Introduction
ecorisk is a package for risk assessment analysis in marine sciences, but can also be applied to terrestrial ecosystems. Risk assessments are an integral part of integrated ecosystem assessments, which are used within ecosystem based management (Levin et al. 2014). The implementation of risk assessments to support ecosystem based management faces a number of challenges, this includes for example
- The assessment on an ecosystem level heavily relies on data driven modeling approaches e.g. (Fu et al. 2018). Those data driven quantitative approaches are not suitable for information limited systems.
- To better support ecosystem based management risk assessments should be able to assess various indicator types, not only single species, but also integrated food web indicators. Other challenges to make risk assessments ready for ecosystem based management have been identified by (Clark et al. 2022).
To better support application of risk assessments in ecosystem based management this package implements a modular framework, where single indicator and pressure combinations are semiquantitatively or quantitatively evaluated and thereafter aggregated to compound risks as well as an ecosystem risk score. The highlights of this framework include:
- Risk assessments from single indicator–pressure combinations up to an ecosystem scale
- Integration of different knowledge types and thus more flexibility
- Assessment of integrated management indicators
- Explicit uncertainty assessment
This article gives you a short introduction to common risk assessment methods and the terminology used within this package, followed by a description of the risk assessment procedure and the ecorisk package theory. For a hands-on tutorial with example data, see the Tutorial article.
Overview of risk assessments
Risk assessments are well known in various scientific fields. This package focuses on marine science (but this does not exclude the application in another context). Within this field, risk assessment methods are commonly divided into qualitative, semiquantitative and quantitative approaches. Additionally risk assessments are classified according to their level of complexity (based on (Holsman et al. 2017)):
Level 1: effects of one pressure on one indicator
Level 2: effects of multiple pressures on one indicator
Level 3: effects of multiple pressures on multiple indicators
Level 3 can be considered as ecosystem level, if the effects of the pressures on the indicators are aggregated and not considered individually. Table 1 gives an overview of applied risk assessment methods assigned to the associated data level and complexity.
Table 1: Overview of different risk assessment methods with papers applying those. Some methods have been applied at different data and complexity levels and are therefore mentioned more often.
| Data / Complexity level | qualitative | semiquantitative | quantitative antitative |
|---|---|---|---|
| Level 1 | Likelihood- Consequence approach (W. J. Fletcher 2005) | Productivity - Susceptibility approach (Patrick et al. 2010; Stobutzki, Miller, and Brewer 2001) | Dose-response assessments (Fahd, Veitch, and Khan 2019; Håkanson 1980; Kramer et al. 2011; Long et al. 1995) |
| Level 2 | Qualitative network model (Giakoumi et al. 2015) | Qualitative network model (Altman et al. 2011; Cook, Fletcher, and Kelble 2014; Reum et al. 2015) Vulnerability analysis (Allison et al. 2009; Cinner et al. 2012; Cinner et al. 2013; Gaichas, Link, and Hare 2014; Graham et al. 2011; Hare et al. 2016) ODEMM framework (Knights et al. 2015) | Ecosystem modelling * (Fu et al. 2018) |
| Level 3 | Qualitative network model (Altman et al. 2011; P. J. Fletcher et al. 2014) Vulnerability analysis (Gaichas, Link, and Hare 2014) ODEMM framework (Knights et al. 2015) | Ecosystem modelling * (Fu et al. 2018) |
* ecosystem approaches are marked with a *
The central question of each risk assessment is:
What is the risk that given the effect of the pressure x on the indicator y, y will reach or remain in an undesirable status?
To evaluate this question various methods have been developed (Fernandes, Vieira da Silva, and Frazão Santos 2022). An often used approach is to assess the exposure of the pressure and the sensitivity of the indicator, but several synonyms are used, thus complicating comparability of the methods. In addition to these two axes some methods assess a third axis: the adaptive capacity or resilience of the indicator. All three compartments are then combined to the vulnerability or in some methods to the risk. Within this framework exposure, sensitivity and adaptive capacity form together the vulnerability. Since the central question includes the current status of the indicator, this has to be included in the risk assessment. (Those methods that do not require status assessment can still use the output values of the vulnerability function of this package and treat them as output of the risk assessment.) In the end risk (or vulnerability) scores help to identify, understand and prioritize the risks resulting from different pressures (International Organization for Standardization 2009).
Aim of the package
With this package we want to facilitate application of risk assessments in information rich and limited situations. We want to encourage users to incorporate different knowledge types, to widen the evidence base. For this purpose ecorisk combines semiquantitative scoring approaches with time series based modelling in one assessment. The framework is built in a modular and flexible manner, covering all complexity levels (see Overview of risk assessments). With ecorisk individual species can be used as indicators as well as integrated biodiversity, food web or life-history indices, for example the HELCOM zooplankton mean size indicator (HELCOM, n.d.) or the OSPAR large fish index (Lynam, C.P. and Piet, G.J. 2023). The framework allows to assess long term pressures as well as short term extreme events, while explicitly accounting for the associated uncertainty. The package is generalistic in terms of the considered spatial and temporal scale and can be applied to a wide range of ecosystems. To enhance communication to a broader public ecorisk provides different plotting functions, which can be customized later on.
Brief summary of package and workflow
The ecorisk package supports the ecorisk framework (Gutte, Möllmann, and Otto 2026) by providing tools for analysis, assessment and communication. The workflow starts with two pathways, which are later on combined to one. One pathway provides functions for expert scoring approaches, the other for risk assessments based on time series data. Both pathways analyse the two vulnerability components exposure and sensitivity for each indicator ~ pressure combination. The adaptive capacity can be analysed within the expert scoring pathway. Both pathways optionally assess the associated uncertainty of each component. After assessment of exposure and sensitivity the package continues within one joint pathway by combining the vulnerability components, assessing the status of each indicator, followed by the calculation of the risk from vulnerability and status. Now the risk scores from each indicator ~ pressure combination can be aggregated to higher complexity levels up to the (eco-)system risk score, which can be plotted thereafter.
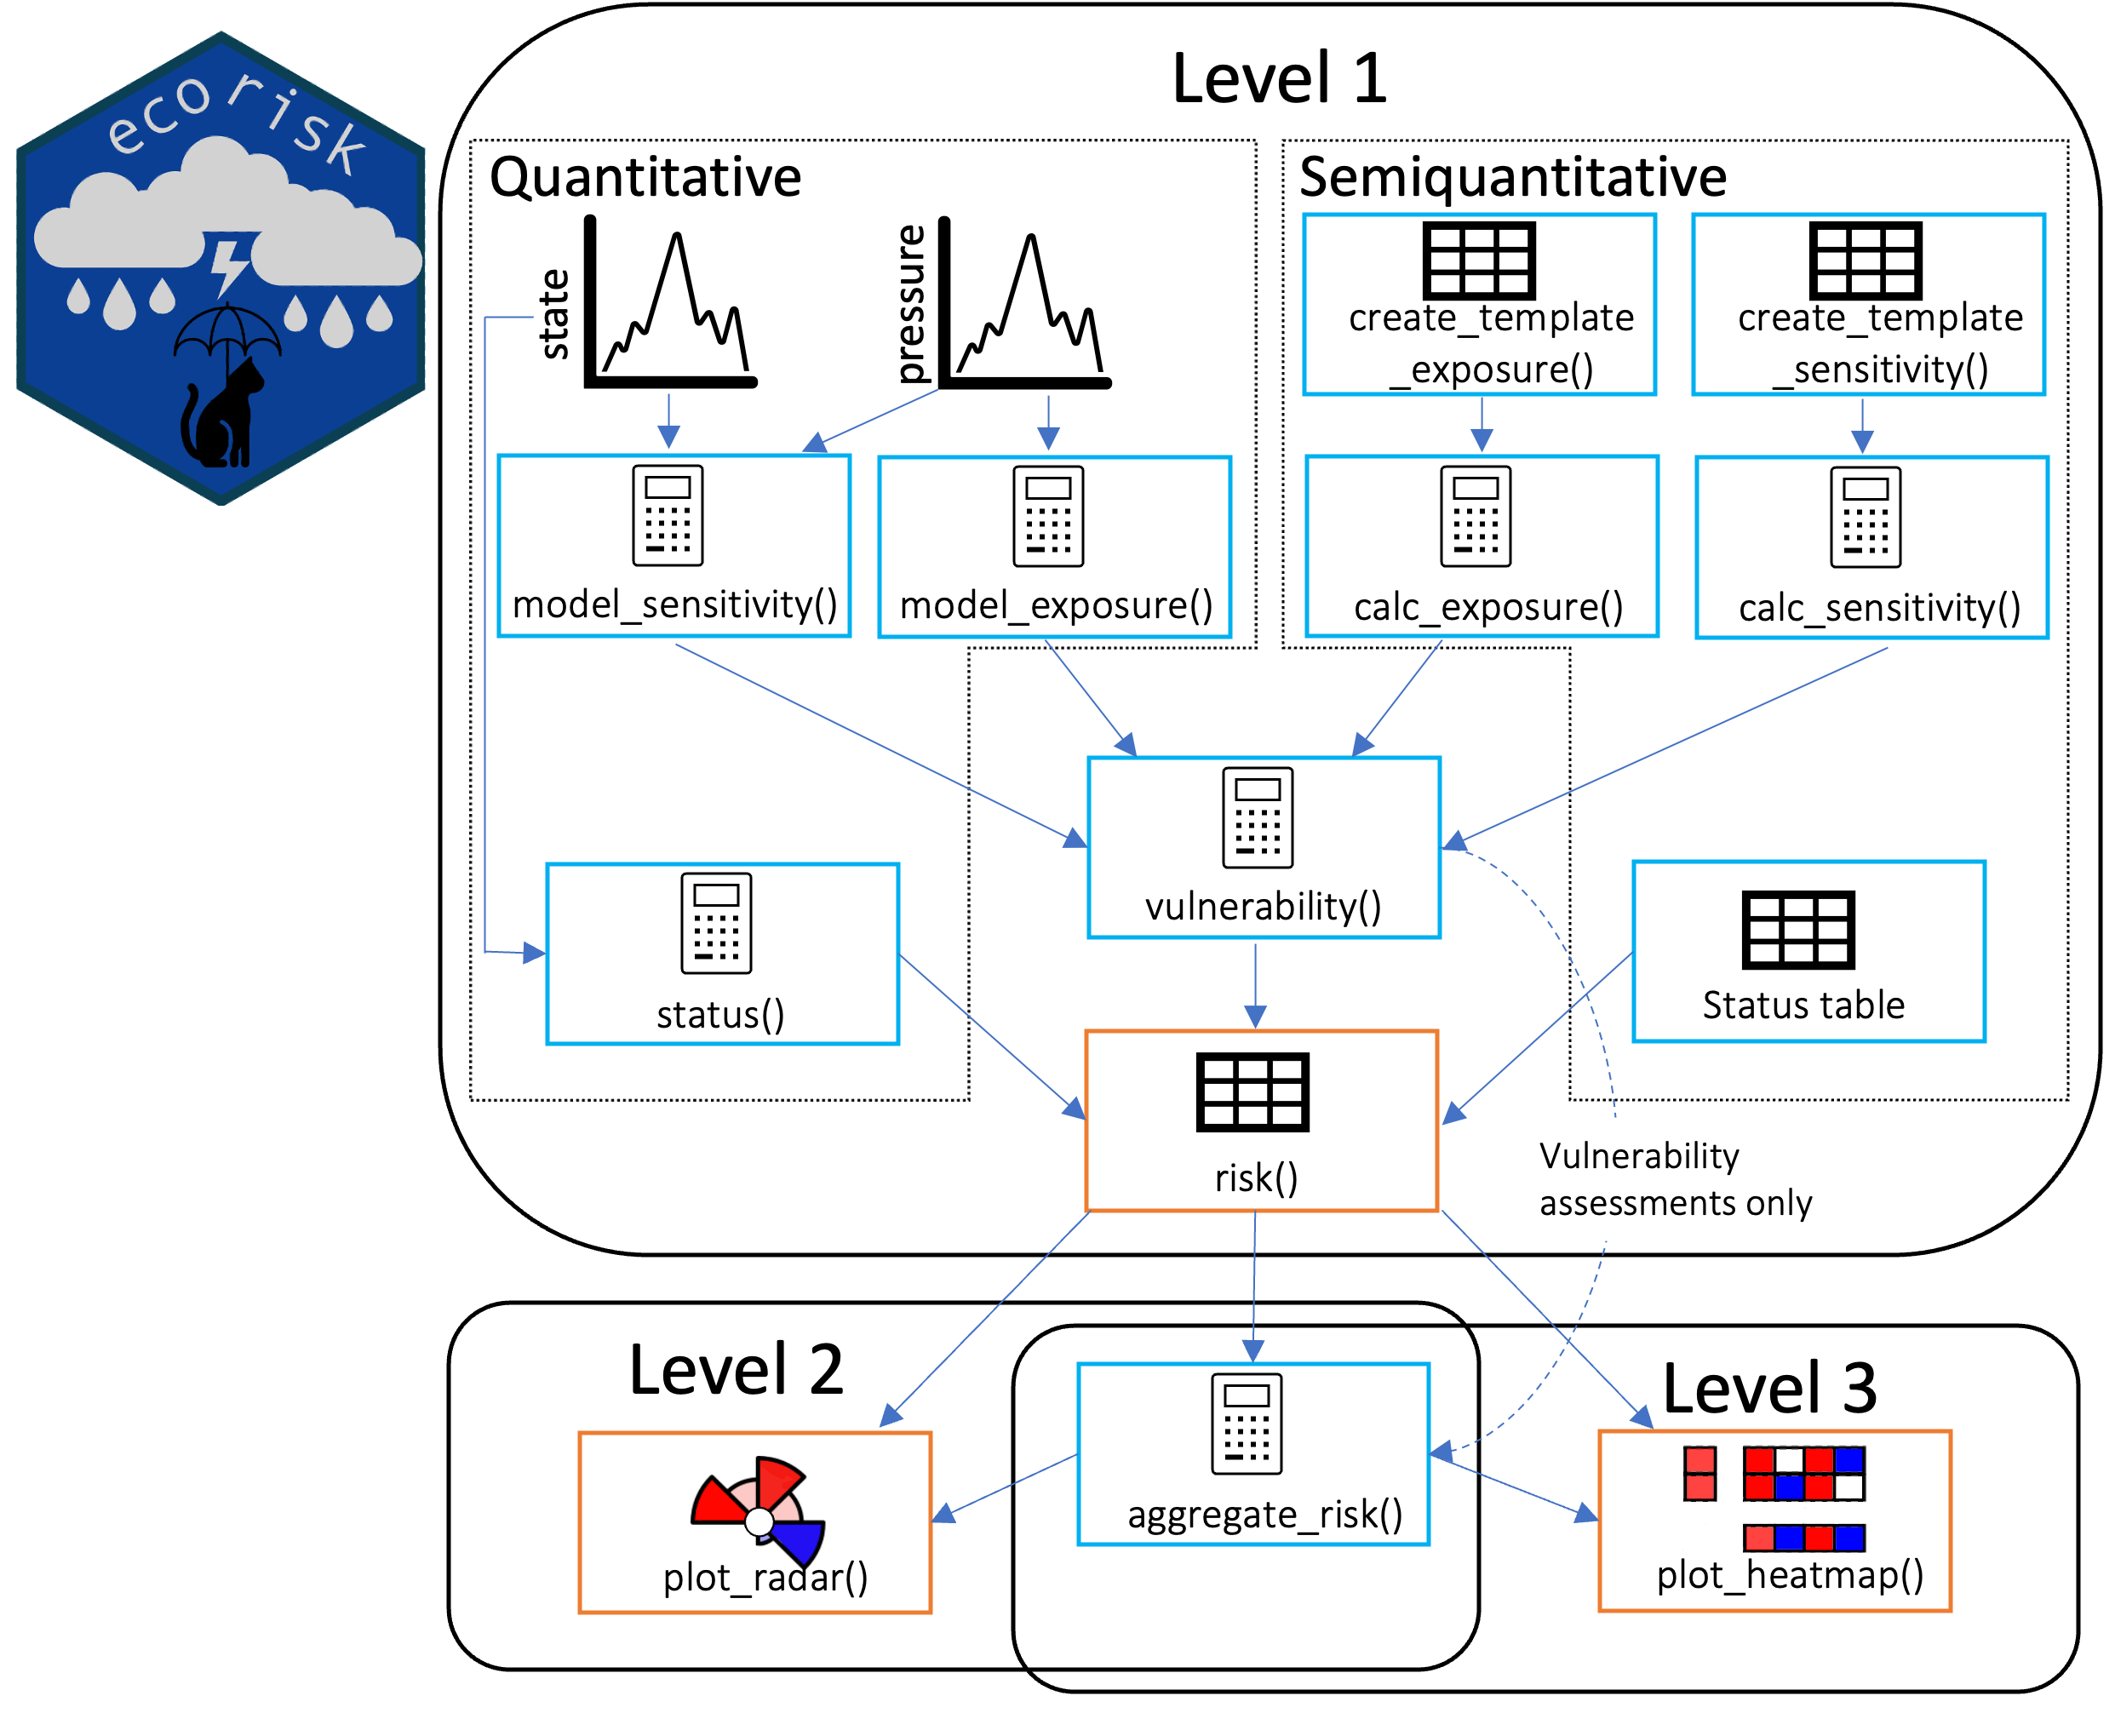
Figure 1: Workflow of the ecorisk package.
How to do a risk assessment
To conduct a risk assessment it is useful to split the process into several parts (Hare et al. 2016):
- a scoping phase
- preparation phase
- scoring phase
- analysis phase
In the following the four phases are explained in the ecorisk context.
Scoping
In the first phase the risk question(s) should be clearly defined. The risk question should also define all relevant spatial and temporal scales. Based on these definitions representative indicators and pressures are chosen for the assessment. Once the selection has been conducted all available data (literature or time series data in the ecorisk context) will be gathered.
Preparation
The preparation depends on the data level of the assessment. For semiquantitative expert scoring it is useful to prepare factsheets about the indicators and the influence of the pressures on them. Scoring guidelines should clearly define each score the experts can give and a scoring template supports an easier analysis of the given scores. For the quantitative time series approach all data must be aggregated to yearly values, e.g. yearly mean temperature or maximum chlorophyll-a concentrations in spring.
Scoring
In the semiquantitative pathway experts will score the risk components exposure, sensitivity and optionally the adaptive capacity. For a better compatibility with the quantitative pathway the following scoring scheme is suggested.
Exposure (E) 1–5 (low to high impact)
Sensitivity (S) −5–5 (high negative impact to high positive impact, a 0 means no influence)
Adaptive capacity (AC) −1–1 (no adaptive capacity to good adaptive capacity)
For all scorings it is recommended to score the associated uncertainty on a scale from 1 to 3 (low to high).
The individual expert scorings will be aggregated using the ecorisk functions for the semiquantitative pathway.
The status can be assessed by the experts too or based on thresholds from the literature (e.g. HELCOM indicator status reports, IUCN red list entries).
For the quantitative pathway the prepared time series are analysed with the ecorisk functions. These will score the exposure, sensitivity and status of the indicator based on the dynamics of the time series. Ecorisk automatically evaluates the uncertainty associated with the exposure and sensitivity scores.
Analysis
The scores from the previous step will be now combined. First vulnerability (V) is calculated as follows:
or if sensitivity was scored to be positive:
The vulnerability scores are afterwards combined with the status to derive the final risk scores. The risk scores can then be combined to higher complexity levels, i.e. cumulative effects of the pressures, cumulative impacts on the indicators and ecosystem risk scores.
The ecorisk package theory
The ecorisk package supports the ecorisk framework (Gutte, Möllmann, and Otto 2026). It provides functions for the semiquantitative expert scoring and a time series based quantitative approach. Ecorisk supports the integration of different knowledge types, iterative risk assessment processes and the analysis of integrated indicators. The ecorisk workflow is split at the beginning into two pathways (Figure 1), depending on the data input. In each pathway individual indicator pressure combinations are analysed for their risk. The pathways are combined again for the assessment of vulnerability and risk.
Risk assessment analysis
For the risk assessment with the ecorisk package the user should have
conducted an expert scoring exercise or prepared time series to analyse.
Example data sets can be found in the ecorisk package. Templates for
exposure and a sensitivity and adaptive capacity scoring can be created
using the functions create_template_exposure() and
create_template_sensitivity(). The output can be saved as
csv or excel file. After they have been filled out by the experts, they
can directly be analyzed further with the ecorisk workflow.
Expert based semiquantitative pathway
The expert scorings are analysed with the functions
calc_exposure() and calc_sensitivity(). Both
aggregate the scores given by the individual expert. In case several
traits have been assessed for the indicators sensitivity, the function
will calculate an aggregated sensitivity score, but will keep the
trait-based scores, thus the vulnerability can be calculated first per
trait and only afterwards be aggregated.
Modelling quantitative pathway
To calculate an exposure score the function
model_exposure() analyses the time series of the pressure.
The user has to provide a base line to which the assessment time frame
should be compared. The function evaluates
how much the conditions of the pressure in the assessment time frame differ compared to the baseline measured in standard deviations,
how often a significant deviation (> 1 standard deviation) from the baseline can be observed in the assessment time frame and
how the future trend of the pressure will likely be based on a linear model.
The function gives for each compartment a score from 1–5 (low to
high) and the future direction of the pressure (increase or decrease). A
spatial scale cannot be evaluated by this function, but the user can
provide a score.
The function model_sensitivity() evaluates the indicators
sensitivity towards the pressure based on the relationship of the
indicator and pressure time series. The relationship will be analysed
using a generalized additive model. It is tested whether the
relationship is significant, if so the strength of the relationship
()
is used to set a score from 1–5 (low to high). In case the relationship
is non-linear (edf > 1), the sensitivity score will be increased by
1. Whether the relationship between indicator and pressure in the
assessment time frame is positive or negative is evaluated using the
slope of a linear model. The uncertainty is scored from 1–3 (low to
high) based on the relation of the confidence intervals of the GAM to
the overall range of the input data.
Vulnerability
The vulnerability() function uses the scores from the
semiquantitative and the quantitative pathway and combines for each
indicator ~ pressure combination the exposure and sensitivity scores.
For the semiquantitative pathway the following equations are applied
(assuming that the experts assessed the ongoing dynamics of pressure and
indicator, meaning a negative expert sensitivity score is negative due
to the pressure dynamics, e.g. the temperature increases which is bad
for the indicator and thus the indicator gets a negative sensitivity
score):
(for negative sensitivity scores)
(for positive sensitivity scores)
In the modelling pathway the direction of the vulnerability depends
on the directions supplied by the model_exposure() and
model_sensitivity() functions. If both have the same
direction a positive effect is assumed, if they have different
directions the vulnerability score will be negative; sensitivity and
exposure are again summed up to derive the vulnerability score.
Status assessment
The function status() compares the conditions of the
indicator in the assessment time frame to the baseline conditions. The
status can be either good or undesired, depending on whether the
indicator stays within the predefined thresholds or not. The user can
parameterize whether the indicator should be in similar conditions as
during the baseline or outside of these conditions. The user can also
use semiquantitative data to assess the status by themselves.
Risk
The final risk score will be calculated by the function
risk(). It combines the vulnerability and the status scores
to a risk score per indicator ~ pressure combination.
Aggregation
The risk scores from all indicator pressure combinations are aggregated to
multi pressure risk scores (all pressures affecting one indicator)
multi indicator risk scores (all indicators affected by one pressure) and
a system risk based on all multi pressure risk scores
using the function aggregate_risk(). If the user has the
scores from several experts it is recommended to run the analysis for
the scores of each expert individually and aggregate the risk scores and
aggregated risk scores from all experts afterwards. This also allows to
assess variance between experts.
What to do now? Plotting!
The results of the risk assessment can be analysed using the two
ecorisk plotting functions plot_radar() and
plot_heatmap(). The first one shows per indicator the multi
pressure risk and the individual risk scores deriving the multi pressure
risk score. The heatmap plot gives an overview over all assessment
results. In the bottom right corner it provides the system risk, the map
shows the risks for each indicator pressure combination and to the left
and at the bottom the multi pressure / multi indicator risks are
displayed. Both plotting functions can show the associated
uncertainty.
For a worked example applying all functions see the Tutorial.